The IRO Industry Landscape helps you benchmark your IRO disclosure coverage against selected industries. It gives you an at-a-glance view of how commonly IROs are disclosed across ESRS topics and subtopics, making it easier to identify potential gaps and focus areas for review.
This tool helps you to:
-
Validate your strategy: Confirm you are covering the right topics by seeing what is best practice in your sector.
-
Save time: Get a clear overview of industry reporting patterns without hours of desktop research.
-
Identify gaps and blind spots: If you have an IRO inventory, you can directly compare your data against industry averages to spot missing disclosures or areas where you may be over-reporting.
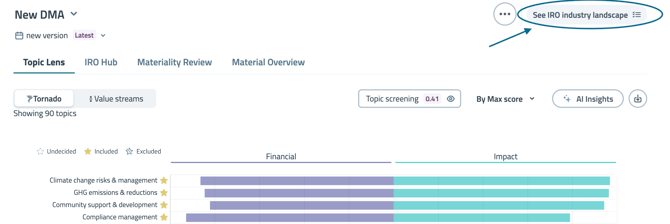
Accessing the IRO Industry Landscape
-
Navigate to your Double Materiality analysis.
-
In the top right of the page, next to the Settings icon, click See IRO Industry Landscape.
Understanding the benchmarking heatmap
The heatmap provides a topic-level view of industry disclosure coverage and helps you quickly see where your IRO inventory may be under-represented.
The heatmap is shown by value stream. Use the Stream dropdown to switch between the value streams in your analysis.
This helps you benchmark IRO coverage where it occurs in the value chain, not just at an overall topic level.

How to interpret the heatmap:
-
The Metric: Each percentage represents the share of companies that published at least one IRO in that topic or subtopic.
-
The Source: Based on publicly available IRO data from companies that have published CSRD compliant or aligned (as of November 2025) financial or sustainability reports.
-
The Scope: The benchmark considers the industries you selected in your Double Materiality settings for your core operations.
Drilling down into ESRS topics and subtopics
To explore a topic in more detail:
-
Click an ESRS topic in the heatmap.
-
The view updates to show the subtopic-level breakdown and its associated statistics.
This helps you pinpoint exactly which subtopics may be driving gaps within a broader ESRS topic.
Benchmarking your IRO Inventory
If you have already populated your IRO inventory within your Double Materiality analysis and mapped IROs to the ESRS, you can use this feature to perform a direct gap analysis against your industry peers.
-
Locate the Compare IROs filter dropdown at the top of the page.
-
Open the dropdown to select which comparisons you want to visualize.
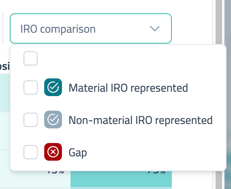
Icon Legend: Understanding the Comparison
Once selected, additional icons will appear next to the ESRS topics and subtopics. Use this legend to understand how your disclosure compares to the industry average:
| Icon | Meaning | Description |
| Material IROs | You have identified IROs in this topic that meet your defined materiality threshold. | |
 |
Not-material IROs | You have identified IROs in this topic, but they do not meet your materiality threshold.* |
 |
Gaps | Your industry peers are reporting IROs in this topic, but you currently have none. |
*Note: If you have not yet defined a materiality threshold in your settings, all your existing IROs will appear as "Not-material" in this view.
This visual comparison helps you instantly spot potential blind spots in your reporting strategy or confirm that your focus areas align with market trends.
Next steps: move from insights to action
Once you’ve identified potential gaps using the heatmap and subtopic statistics, you can review industry summaries and generate Proposed IROs directly in the platform.
🔗 See: Closing IRO Gaps with Industry Summaries & Proposed IROs in IRO Industry Landscape