
Topic Monitoring shows not only which topics moved between two DMA versions, but how each topic is moving against the Topic Screening interval and what is driving the change. This article covers how movement is read and what you see when you drill into a topic.
For an introduction to Topic Monitoring, including how to compare two versions and the three groupings, see Comparing DMA Versions with Topic Monitoring.
How movement is read
Movement is read against the Topic Screening interval, the relevance threshold a topic needs to meet to be carried forward in the analysis. For each topic, Topic Monitoring compares the score in the older snapshot with the score in the newer snapshot and reads the change as movement toward the interval, away from it, or holding its position, on the financial axis, the impact axis, or both.
The interval sets a relevance threshold, not a materiality decision. Materiality is decided separately, at IRO level, within the DMA.
Note: movement is read as direction against the interval rather than as a raw percentage change, which can overstate small moves on low-scoring topics and understate meaningful moves on established ones.
Drilling into a topic
Click a topic in any grouping to open a side panel.
Topic detail
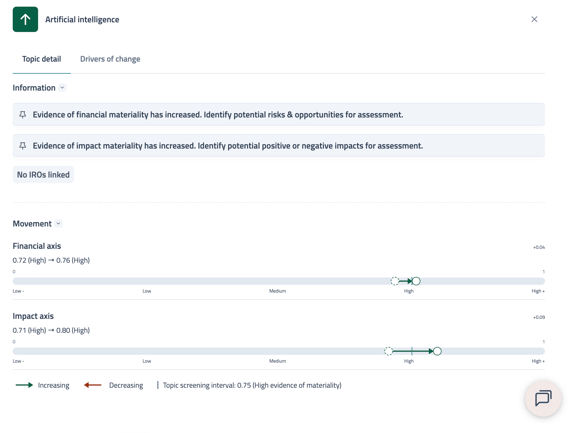
The first tab, Topic detail, shows how the topic moved between the two snapshots, with the underlying scores for the financial axis and the impact axis. This tab is available for topics in any grouping, so you can open a Topics to maintain or Topics to watch topic to confirm how little it moved.
Drivers of change
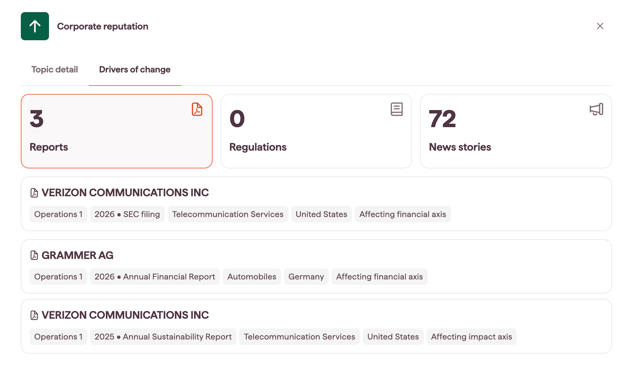
The Drivers of change tab shows the evidence behind the movement, grouped by source. This tab appears only for topics in the Topics to review grouping, since Topics to maintain and Topics to watch have no movement that needs explaining.
The tab shows the sources for the axis flagged for review. If both axes are flagged, both sets are shown and tagged by axis so you can tell which evidence relates to which axis.
Sources always appear in the same order, Regulations, then Reports, then News, regardless of which source drove the most change. If a source has no contributing items, it is shown with a count of 0 and a short message rather than hidden, so the layout stays consistent across topics. Counts reflect what drove the change, not what was ingested.

Regulations
Regulations newly added or updated since the older snapshot. Unlike reports and news, regulations are not filtered by a contribution score, so all new and updated regulations are listed. Each regulation is tagged by source type (mandatory or voluntary, and consultation where relevant), whether it is new or updated, and the axis it affects. Click a regulation to open its full content.
Reports
Company reports whose scores drove the topic's movement. Reports that were ingested but did not move the topic are not listed. For each report you can see the company name, report year, report type, industry, and the country where the company is headquartered. Click on the report to review the mentions to the topic in details.
News
News stories that are new since the older snapshot, or existing stories that have grown (for example from 52 to 100 articles), which represents an evolving signal. Each story is tagged by category (for example, opportunity, risk, or adverse event) and the axis it affects, and opens in a separate tab so you can read the full article.