
The Overview tab is where the Executive Dashboard lists every risk relevant to your selected industries and sorts them into two prioritisation buckets, Action Required and Monitored, by likelihood.
It is the starting point for the dashboard. From here you can see which risks need action now, which to monitor, and where your current reporting leaves gaps.
Why this matters
- You see, in one view, which risks need action now and which only need monitoring
- You can spot blindspots where a high-likelihood risk is not yet covered in your 10-K or Annual Report
- You get a summary you can refresh each quarter and share with senior leaders
- It guides your Annual Report and disclosure decisions through a likelihood-versus-coverage gap analysis
How the Overview tab organises risks
Based on your analysis setup, every risk across the external universe is analysed and assigned a likelihood score, according to how prevalent it is in narrative sources relevant to competitive, short-term regulatory, long-term regulatory and reputational risks. Risks then fall into two prioritisation buckets.
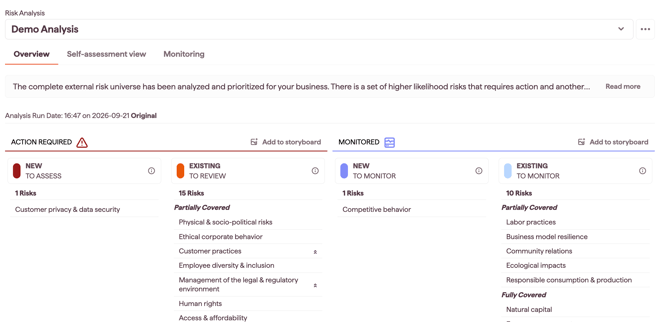
Action Required and Monitored
- Action Required: risks with a higher likelihood score, which need review and action now. Split into two columns:
- New to assess: risks not covered in the risk section of your 10-K or Annual Report
- Existing to review: risks currently fully or partially covered in that risk section
- Monitored: risks with a lower likelihood score, which you should keep an eye on. Split into two columns:
- New to monitor: risks not covered in the risk section of your 10-K or Annual Report
- Existing to monitor: risks currently fully or partially covered in that risk section
Within each column, risks are listed by likelihood score, with the highest at the top.
What "covered" means
For the two Existing columns, coverage shows how much of the risk your reporting already addresses:
- Fully covered: every topic in the risk, as defined in your selected industry(-ies) universe, is included
- Partially covered: at least one topic in the risk, as defined in your selected industry(-ies) universe, is not included
How risks are scored and ordered
The dashboard uses three metrics to place each risk:
- Likelihood score: sets whether a risk appears under Action Required (higher likelihood) or Monitored (lower likelihood), and the order risks appear in within each column
- Velocity score: adds an icon to any risk whose likelihood has risen over the past three months
- Public Risk Disclosure: determines whether an existing risk is Fully covered or Partially covered, which sets its column under Existing to review or Existing to monitor
Note: a risk's likelihood score reflects how prevalent it is across the narrative sources Datamaran analyses, normalised so different sources are comparable.
Where to start
Give immediate attention to New to assess and Existing to review risks. These are the high-likelihood risks with a gap between how likely they are and how much you currently disclose.