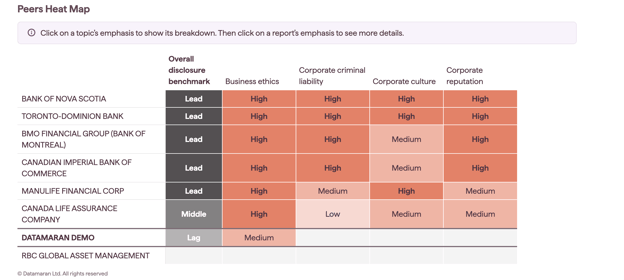
The Competitive Risk driver compares how you and your peers disclose a risk, based on corporate reporting analysis, so you can see where you lead, sit in the middle, or lag.
To open it, select a risk on the Overview tab, choose the Drivers tab, then select Competitive Risk.
Why this matters
- See how your disclosure of a risk compares with your peers
- Spot where peers say more than you on a topic, which can point to a gap
- Decide where to strengthen your own reporting
What the tab shows
Pie charts
The pie charts show the percentage of your own financial and sustainability reports that mention the risk, so you can see the report types and where the risk is discussed.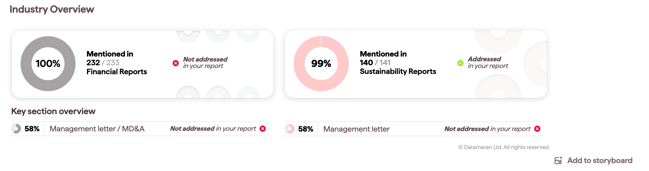
Heatmaps
The heatmaps show how much each peer discloses on the risk in their latest reports. Choose an emphasis level to see how competitors address a topic in the Mention viewer.
Disclosure is measured using Datamaran's Emphasis Score, which looks at the total number of mentions of a topic, mention location and report lenght.
Your position: Lead, Middle or Lag
Topic scores add up at the risk level into an Overall disclosure benchmark, which places each company as:
- Lead: discloses more than benchmarked peers
- Middle: in line with peers
- Lag: discloses less than peers
This compares each company's disclosure across their latest annual sustainability and financial reports.