The Monitoring tab shows how your external risks change over time, as a snapshot you can refresh, and tracks how your regulatory landscape is shifting.
It is one of the three Executive Dashboard tabs, alongside Overview and Self-assessment view.
Why this matters
- See which risks are rising, falling or holding steady over a period
- Spot risks with a statistically significant increase in likelihood
- Track how mandatory and voluntary regulatory activity on your issues is changing
The risk snapshot
Log into the Executive Dashboard and open the Monitoring tab. If you have not generated a new version of your analysis in a while, click Generate New Version first.
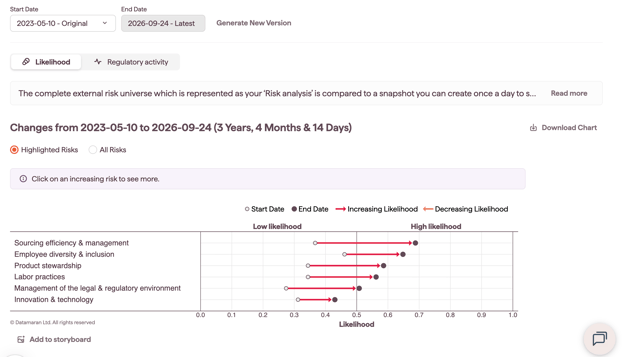
The chart lists your risks on the Y-axis and their likelihood score on the X-axis (calculated from prevalence across all analysed sources). You can view it two ways.
Highlighted Risks
Datamaran's recommended view. It highlights the risks with a statistically significant increase in likelihood, those exceeding the average increase.
All Risks
Ranks the risks on the Y-axis by their new position, showing whether each has increased, decreased or stayed stable over the selected period.
Tip: generate a new version at least quarterly to keep a fresh read on emerging risks.
The Regulatory activity tab
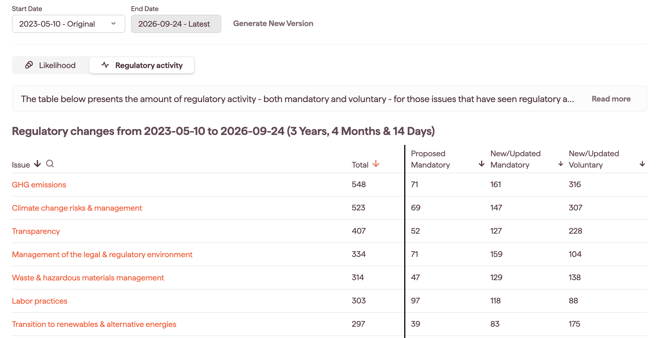
The Regulatory activity tab, within Monitoring, shows how much regulatory activity, both mandatory and voluntary, each issue has seen over the period being monitored.
By default the table sorts by the issues with the highest total activity. Issues are grouped by:
- proposed mandatory regulations
- new or updated mandatory regulations
- new or updated voluntary initiatives
Click any issue name to see the regulations behind it.