
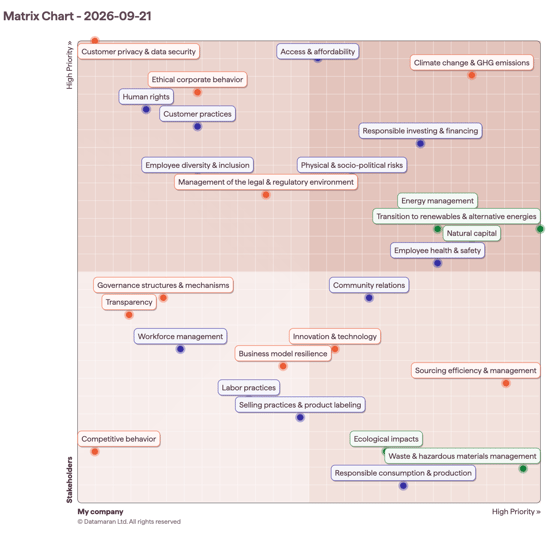
Datamaran’s fully flexible stakeholder matrix lets you tailor the visualization to match your company’s needs. You can:
-
Rename the X-axis and Y-axis labels to fit your terminology.
-
Adjust the High, Medium, and Low priority thresholds in the curves view.
Tailoring your Stakeholder matrix
-
Save and run your matrix.
-
Go to the Matrix View tab.
-
Under Actions (right side of the page), click Chart Settings.
-
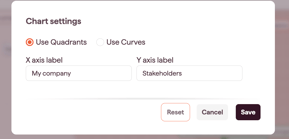
In Chart Settings:
-
Use the X-axis label and Y-axis label boxes to rename the axes.
-
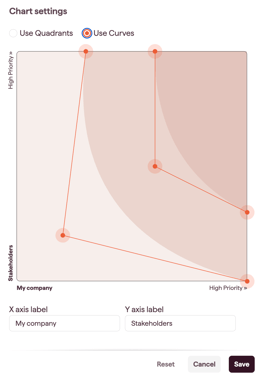
In the Curves View, click and drag any point on the curves to adjust thresholds for High, Medium, and Low relevance.
-
-
To reset parameters to the default, click Reset.
-
When you are satisfied with your adjustments, click Save.